1. Introduction
Almost everyone who discusses politics uses a spatial metaphor. People are placed on a line from left to right, or on a plane crossing an economic axis with a social one. These metaphors are not idle. They structure how citizens describe themselves, how journalists summarize coalitions, and how survey researchers build instruments. The most influential popular version, the two-dimensional Political Compass, crossing an economic left–right axis with an authoritarian–libertarian axis, has been taken by tens of millions of people and is routinely cited as though its two axes were established facts about the organization of belief.
The premise of this paper is that the adequacy of such a model is not a matter of taste. It is a measurement claim. To assert that political belief is organized along a particular set of axes is to assert that responses to political questions, when collected at scale, will exhibit a corresponding correlational structure. That claim is testable, and the tools to test it—common factor analysis, retention diagnostics, and confirmatory modeling—are old and well understood. If the asserted axes are real, the data will recover them. If they are not, no amount of conceptual elegance rescues them.
This paper proceeds in the spirit of adversarial self-examination. A recurring failure mode in writing about ideology is that authors propose a framework whose axes happen to place the author at a flattering center, and then defend it with selective illustration. To guard against that failure, we pre-registered a specific four-dimensional reconstruction and, critically, pre-committed to the empirical conditions under which it would be declared wrong. We then ran the test on public data and report what we found, including the parts that contradict the hypothesis we began with. The four-dimensional model we set out to validate was, in the central respect, disconfirmed. We consider that the most useful result in the paper.
Two questions organize the work. First, how many dimensions does mass political belief actually exhibit, and do they correspond to the axes the popular compass names? Second, to the extent the popular vocabulary fails, is the failure merely that it has too few axes, or is it that its labels have detached from the positions they are supposed to track? We address the first with the American National Election Studies (ANES) 2020 Time Series and the second with five decades of the General Social Survey (GSS).
2. The labels were never stable: terminological drift
Before turning to dimensionality, it is worth establishing why the labels themselves are unreliable instruments. The word “liberal” is the clearest case. In its classical sense, developed across the seventeenth through nineteenth centuries, liberalism named a commitment to individual rights, limited government, free exchange, and universal rather than group-specific standing before the law. Over the twentieth century, especially in the United States, the same word came to denote an expanded role for the state in correcting market outcomes and advancing group equity. The label did not change; its referent did. A person who in 1900 would have been called a liberal for opposing entrenched state power might, using the identical word, be coded as its opposite a century later.
This is not merely an etymological curiosity. If a label's substantive content shifts while the label persists, then any compass built on that label is measuring a moving target. The position “liberal” will appear stable across decades in a time series even as the people who claim it hold materially different views. We can test this directly. The General Social Survey has asked Americans to place themselves on a seven-point liberal–conservative scale, and to answer a battery of concrete policy questions, continuously since the 1970s. If the label's meaning is stable, the policy profile of self-identified liberals should be roughly constant. If the label has drifted, that profile will move.
We constructed a composite policy index from nine GSS items spanning welfare, health, and education spending; support for government action to improve living standards and reduce income differences; and social questions including abortion, marijuana, and capital punishment. Each component was standardized and oriented so that higher values indicate the historically liberal position. We then held the self-identification label fixed and tracked the mean policy index of self-described liberals, and separately of self-described conservatives, across every available year from 1972 to 2024.
The result is a directional and asymmetric drift. Among self-identified liberals, the substantive policy index moves markedly across the period; the rank correlation between year and the liberal group's mean policy position is large and positive (Spearman ρ ≈ .87). Among self-identified conservatives the same correlation is near zero. We are deliberately careful about how to read this asymmetry, because a cross-sectional group mean can change either because a label's referent migrated (content drift) or because different people adopted the label (composition). Two checks distinguish them. First, the share of GSS respondents self-identifying as liberal changed only modestly over the window (on the order of one to two percentage points), so the much-cited doubling of liberal identification—which is measured among Democrats specifically—does not describe this sample and cannot be driving the group-mean shift. Second, a birth-cohort decomposition (reported in Section 5.4) attributes roughly 98 percent of liberals' policy movement to within-cohort period change and almost none to cohort composition: the same cohorts holding the label moved. The drift in what “liberal” denotes is therefore content, not turnover. We do not, however, claim the converse for “conservative.” That conservative self-identification shows little temporal drift in this index should not be read as evidence that the conservative label is well anchored to operational policy; the long line of work from Free and Cantril through Ellis and Stimson establishes the opposite—that the American public is symbolically conservative while operationally more liberal, so conservative self-identification is the more symbolic, less operational label. Temporal stability and operational anchoring are different properties, and we claim only the first.
A second, complementary form of drift concerns not the content of a label but its function. We tracked the correlation between ideological self-placement and party identification across the same period. In the 1970s, ideology and party were loosely coupled; a meaningful share of conservatives were Democrats and of liberals Republicans. Over five decades that coupling tightened substantially: the absolute correlation between self-placement and party rose by a large margin from the earliest to the most recent years. As ideology and party fused, the ideological label increasingly functioned as a marker of partisan team membership rather than a summary of policy preferences. This is the structural signature of affective polarization, in which group identifiers come to carry emotional and tribal weight that exceeds their descriptive content.
Together these two findings establish the precondition for everything that follows. Whatever the popular compass measures, it measures it with labels whose meaning is neither stable across time nor cleanly tied to policy. The next question is whether the axes themselves—independent of the labels—correspond to the structure of belief.
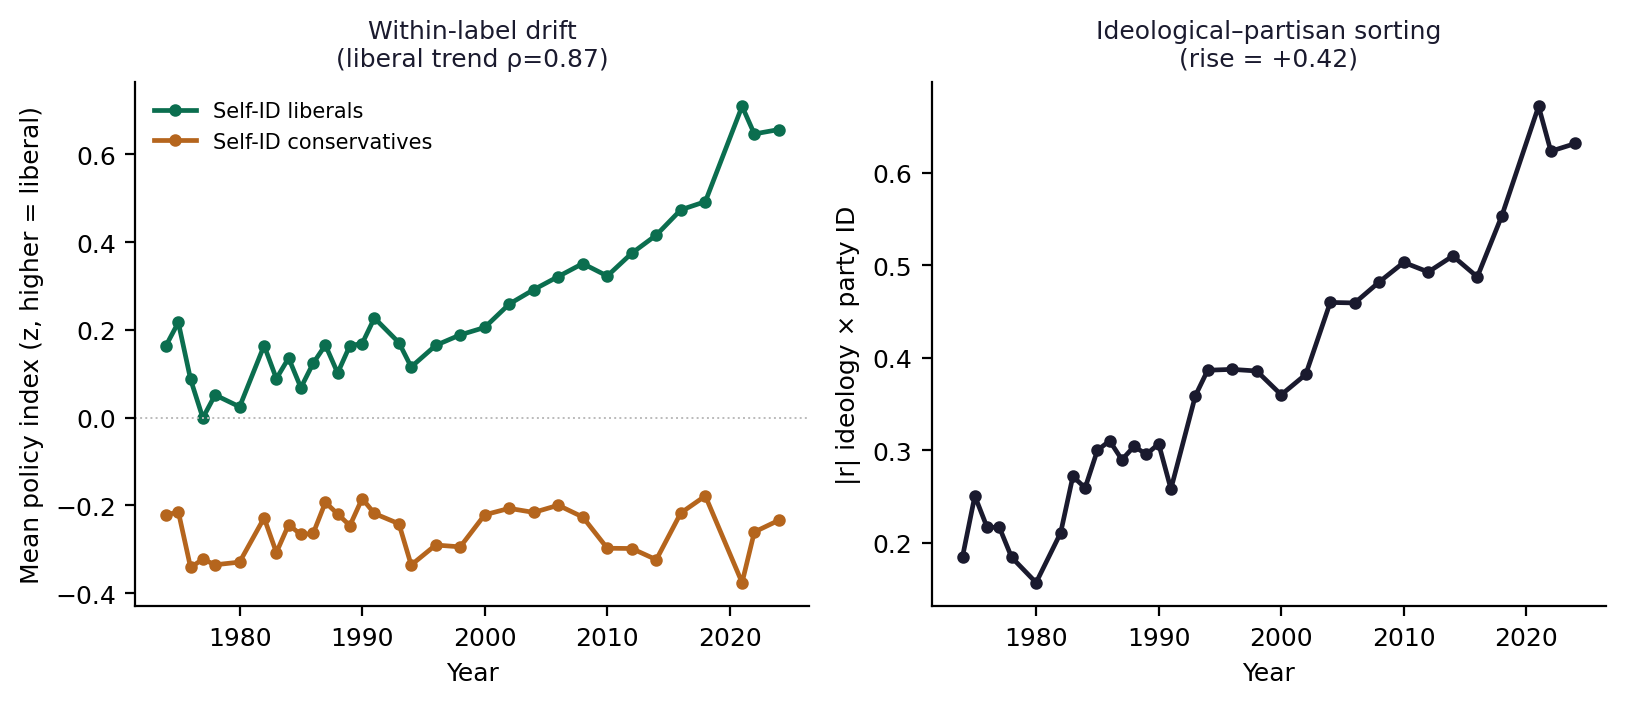
Figure 3. Terminological drift in the GSS, 1972–2024. Left: substantive policy position of self-identified liberals shifts over time while conservatives' is comparatively stable. Right: ideology and party identification fuse over five decades.
3. A pre-registered four-dimensional hypothesis
We began this study expecting that the popular compass was not wrong so much as incomplete, and that a richer four-dimensional model would fit better. We specify that hypothesis here in the form it took before any data were examined, because the value of a disconfirmation depends entirely on the prediction having been fixed in advance.
The four hypothesized dimensions were: (1) Economic intervention, ranging from market provision and limited government to redistribution and regulation; (2) Social authority, ranging from individual autonomy to hierarchy, order, and the enforcement of tradition; (3) Universalism–particularism, distinguishing a commitment to uniform individual standing and evidence-based, group-blind treatment from a commitment to group identity and group-specific redress; and (4) Epistemic orientation, distinguishing reliance on expertise, evidence, and falsifiability from reliance on intuition, tradition, sacred values, and ordinary judgment over expert consensus.
For each dimension we selected marker items from the ANES 2020 Time Series in advance, oriented each to a common polarity, and committed to a fixed set of retention and fit criteria. A factor would be retained if its observed eigenvalue exceeded the ninety-fifth-percentile threshold from parallel analysis on random data of identical dimensions, with Velicer's minimum average partial test reported as corroboration. The four-dimensional model would be judged supported only if at least four factors were retained, the pre-specified marker items loaded on their intended factors with primary loadings above .40 and cross-loadings below .30, the solution replicated across a random split of the sample with Tucker congruence of at least .90 for the first four factors, and a confirmatory model of the hypothesized pattern reached comparative and Tucker–Lewis fit indices of at least .90 with root-mean-square error of approximation and standardized root-mean-square residual no greater than .08. We further committed that if fewer than four factors were retained, we would report the empirically supported number rather than the hypothesized four. That commitment is what the following section discharges.
4. Method
Data are the ANES 2020 Time Series public release (collected around the 2020 U.S. general election). Twenty-one items mapped to the four hypothesized dimensions survived recoding with sufficient valid responses. ANES non-response and inapplicable codes were set to missing. Because the item set is large and listwise deletion would discard most respondents, correlations were computed pairwise. For ordinal items we estimated polychoric correlations—the appropriate choice for Likert-type data, which recovers the latent continuous association underlying ordered categories—falling back to Pearson correlations only for near-continuous items. The resulting matrix was projected to the nearest positive-semidefinite correlation matrix before extraction.
Sampling adequacy was assessed with the Kaiser–Meyer–Olkin (KMO) statistic and Bartlett's test of sphericity. Factor count was determined by parallel analysis (three hundred random replications) and MAP. Common factors were extracted by iterated principal-axis factoring and rotated obliquely by promax, allowing factors to correlate, since substantive political dimensions are not expected to be orthogonal. Replication was assessed by randomly splitting the sample in half, re-deriving the solution in each half, and computing Tucker's congruence coefficient between matched factors. Finally, the hypothesized four-factor pattern was fit as a confirmatory model by maximum likelihood, with comparative fit index (CFI), Tucker–Lewis index (TLI), RMSEA, and SRMR reported against conventional thresholds.
The entire pipeline was implemented in a dependency-light scientific-Python stack and validated end-to-end on data with a known three-factor structure before application, where it correctly recovered the planted loadings and fit indices. All analysis code, the pre-registered item map, and the retention and fit criteria are deposited alongside this paper so that every reported number can be reproduced from the public microdata.
5. Results
5.1 The data are highly factorable but do not support four dimensions
The correlation matrix was strongly factorable: the overall KMO statistic was .87, comfortably in the range conventionally described as meritorious, and Bartlett's test decisively rejected sphericity. There is ample common variance to analyze; any failure to recover four factors is therefore a substantive finding about structure, not an artifact of weak data.
Both retention rules agreed, and both contradicted the hypothesis. Parallel analysis retained three factors; MAP reached its minimum at three. The observed eigenvalues were 6.51, 1.87, and 1.08 for the first three factors, with the fourth at 1.00—below the parallel-analysis threshold of 1.06 and therefore attributable to chance. The pre-registered four-dimensional model fails its first and most basic test: the data contain three separable dimensions, not four.
The three-factor solution is highly stable. Across a random split of the sample, the matched factors replicated with Tucker congruence coefficients of .97, .99, and .99—well above the .90 standard for factor equivalence. Whatever these three dimensions are, they are not noise.
We should be candid about the fourth factor, because the count sits close to the retention boundary and an earlier draft of this paper did not report the adjudicating number. The fourth factor's eigenvalue (1.00) fell just below the parallel-analysis threshold (1.06), and its split-half Tucker congruence is .92—above the .90 equivalence standard. In other words, the fourth factor is weak but replicable, not noise. We therefore treat 'three' as a soft lower bound on the number of replicable dimensions in this battery rather than a hard count, and we do not rest the paper's argument on the precise figure. What the data robustly support is that the structure is multidimensional, that the dominant dimension fuses domains the popular vocabulary treats as separate, and that two of our four pre-registered axes are not among the recovered dimensions.
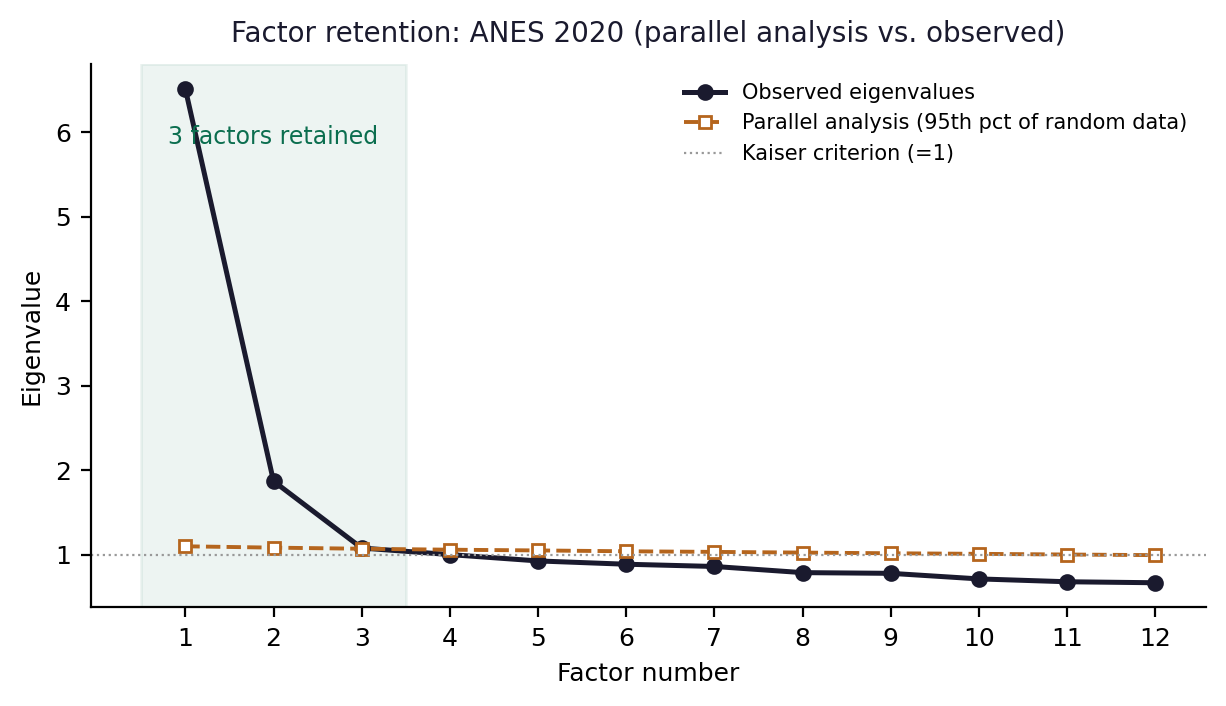
Figure 1. Factor retention by parallel analysis. Observed eigenvalues exceed the random-data threshold for three factors; the fourth falls below it.
5.2 What the three factors are
The oblique pattern matrix gives the three factors clear interpretations, none of which matches the four-axis map cleanly. The first and dominant factor loads strongly on the economic-redistribution items—opposition to or support for government action on income inequality (the strongest single loading), government health insurance, guaranteed jobs, and welfare spending—and, crucially, also on the racial-attitude items and the climate item. Beliefs about whether Black Americans have received less than they deserve, and about government assistance to Black Americans, load on the same factor as beliefs about income redistribution. The hypothesized universalism–particularism dimension did not emerge as a separate axis; its marker items were absorbed into the dominant ideological factor.
The second factor is the cleanest in the solution. It is defined almost entirely by the four child-rearing value items—whether it is more important for a child to be obedient or self-reliant, to have good manners or curiosity, to be respectful or independent, to be well-behaved or considerate—with loadings between .73 and .83 and weak loadings elsewhere. This is the classic measure of the authoritarian–conformity disposition, and it stands as a genuinely distinct dimension, correlated with but separable from the dominant ideological factor (inter-factor correlation .46).
The third factor collects the issue self-placement and spending-direction items, capturing a dimension of preferred government scope that partly mirrors the first factor but is statistically distinct (its correlation with the spending-direction factor is .49). It is best understood as a method-of-response or scope dimension rather than a fresh substantive principle.
The most consequential failure concerns the fourth hypothesized dimension. The epistemic-orientation items—trust in ordinary people over experts, the need for experts to understand science, vaccine-risk skepticism—do not cohere into a factor. Their primary loadings are weak across all three retained factors; the “trust ordinary people over experts” item reaches a maximum loading of only about .23, and the others are scarcely better. Whatever divides evidence-oriented from intuition-oriented citizens in 2020, it is not a single coherent dimension recoverable from these items. We report this failure rather than discard the items, because a pre-registered dimension that does not materialize is itself evidence about the organization of belief.
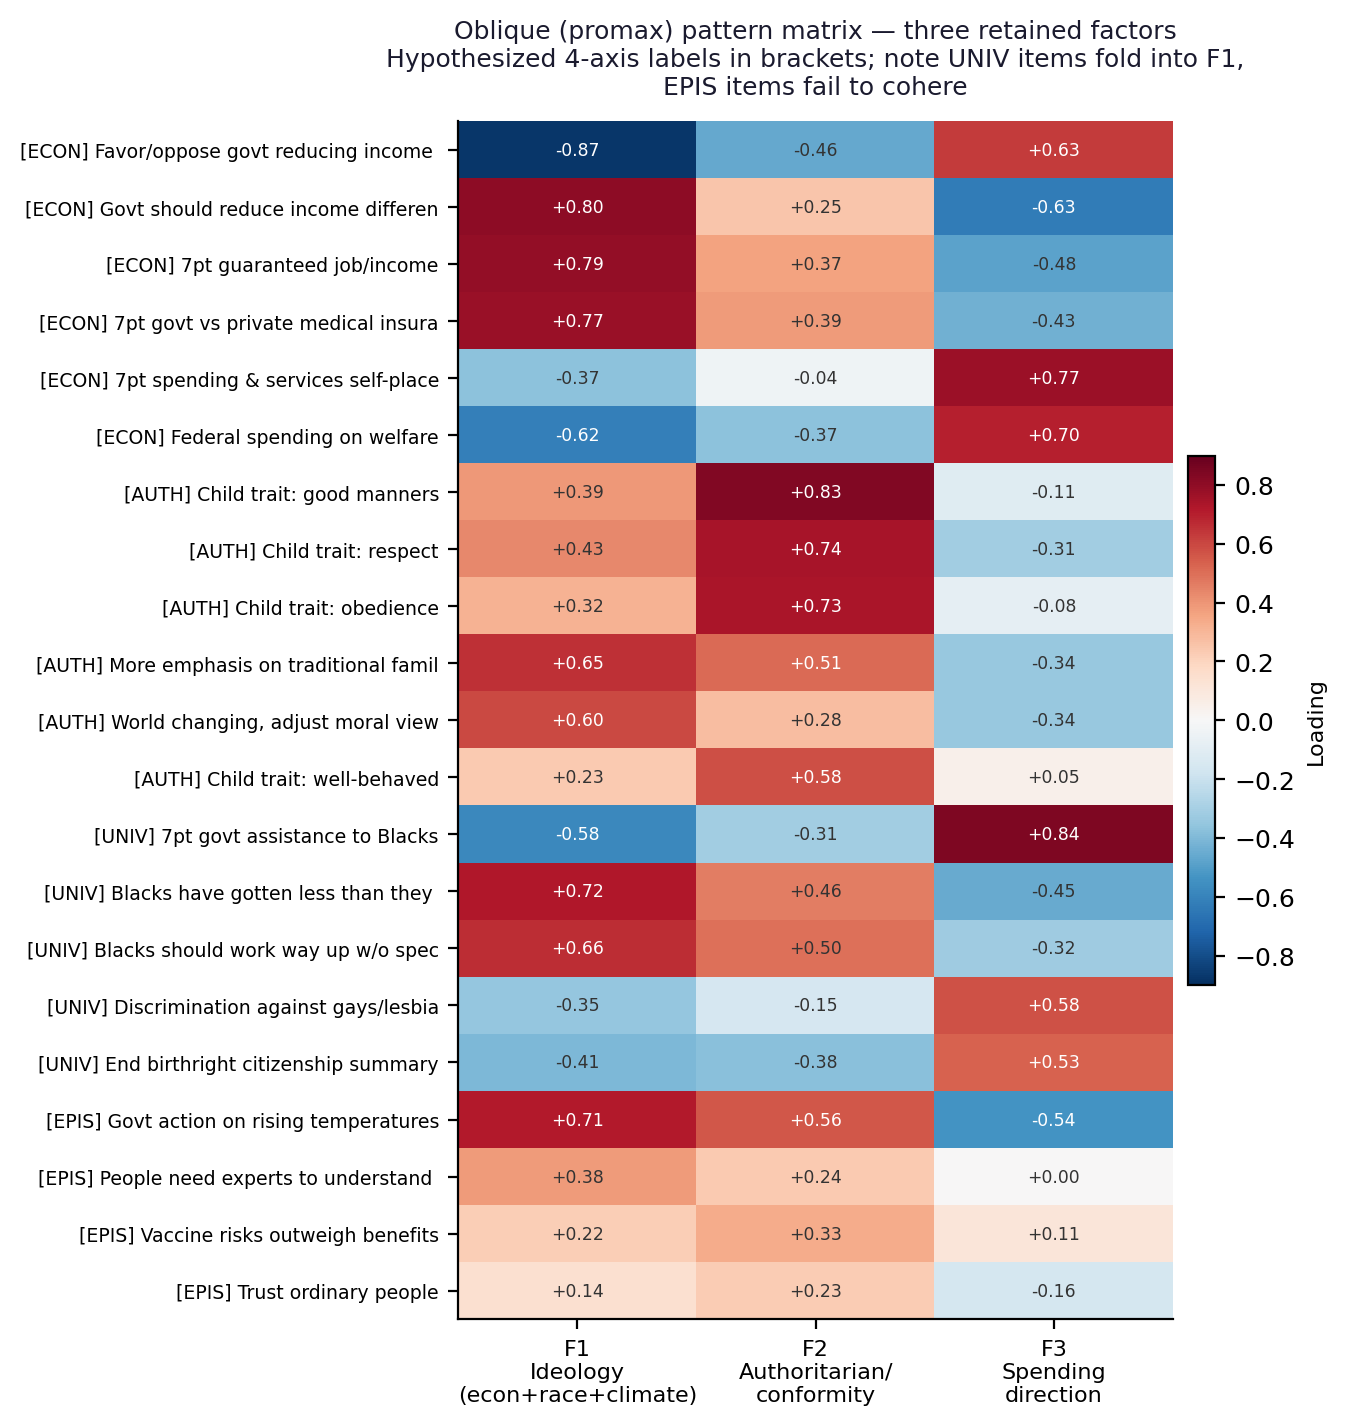
Figure 2. Oblique (promax) pattern matrix for the three retained factors. Bracketed labels are the hypothesized four-axis assignments; universalism items fold into Factor 1 and epistemic items fail to load.
Summary of pre-registered tests
| Test | Result | Pre-registered criterion / reading |
|---|---|---|
| KMO sampling adequacy | 0.87 | Highly factorable (≥.80 meritorious) |
| Bartlett sphericity | p < .001 | Rejects identity matrix; common variance present |
| Parallel analysis | 3 | Factors with eigenvalue > 95th-pct random |
| Velicer MAP | 3 | Corroborates parallel analysis |
| Eigenvalues (1–4) | 6.51, 1.87, 1.08, 1.00 | 4th (1.00) below threshold (1.06) |
| Split-half congruence | 0.97, 1.00, 0.99 | ≥.90 = factor equivalence (met for 3) |
| 4-axis CFA: CFI / TLI | 0.70 / 0.65 | ≥.90 required — not met |
| 4-axis CFA: RMSEA / SRMR | 0.15 / 0.12 | ≤.08 required — not met |
Table 1. Summary of pre-registered tests and outcomes (ANES 2020 Time Series).
5.3 The confirmatory test
Fit confirms the exploratory verdict. The confirmatory model imposing the hypothesized four-factor pattern fits poorly: CFI = .70 and TLI = .65, both far below the .90 threshold; RMSEA = .145 and SRMR = .120, both well above the .08 ceiling. The pre-registered four-dimensional model is rejected on every fit criterion we committed to in advance. The popular two-axis compass is too coarse, but the specific four-axis enrichment we proposed is not the remedy: two of its four axes do not exist in the data as specified.
5.4 Robustness: is the third factor a method artifact, and is the drift compositional?
Two objections threaten the substantive reading above, and because each is a sharp empirical claim we test rather than argue them. The first: the third factor might be common-method variance produced by the several items sharing a seven-point self-placement response format, in which case the substantive structure would be just two dimensions—redistribution and authority—which is the popular compass. The second: the drift in Section 2 might reflect compositional change rather than content drift.
On the first, we ran two tests. Removing the five seven-point self-placement items and re-running retention does not collapse the structure to two: parallel analysis still returns three factors on the sixteen remaining items across random seeds, though MAP drops to two, indicating a weaker but format-independent third dimension. More directly, a confirmatory model that specifies a dedicated method factor on exactly those five items does not improve fit over a model without it (comparative fit index .666 versus .663; identical RMSEA and SRMR to three decimals). A method factor that absorbs no misfit is not capturing real shared variance. The hypothesis that the third factor is an artifact of question format is thus rejected by the test designed to confirm it. The third factor is a genuine if modest scope-and-direction dimension, not a wording effect.
On the second, because the GSS is a repeated cross-section without panel identifiers, true within-person decomposition is impossible; but a birth-cohort decomposition is feasible and is the appropriate test. Decomposing the change in self-identified liberals' policy index from the pre-1990 to the post-2010 period into within-cohort (period) and between-cohort (composition) components attributes 97.6 percent of the movement to within-cohort period change and essentially none to composition. Combined with the near-constant prevalence of liberal self-identification in this sample, this establishes that the drift is content, not turnover—the same birth cohorts holding the label moved leftward over time. The drift finding survives the decomposition that was meant to dissolve it, while—as noted in Section 2—we withdraw any implication that the comparatively stable conservative label is therefore operationally anchored.
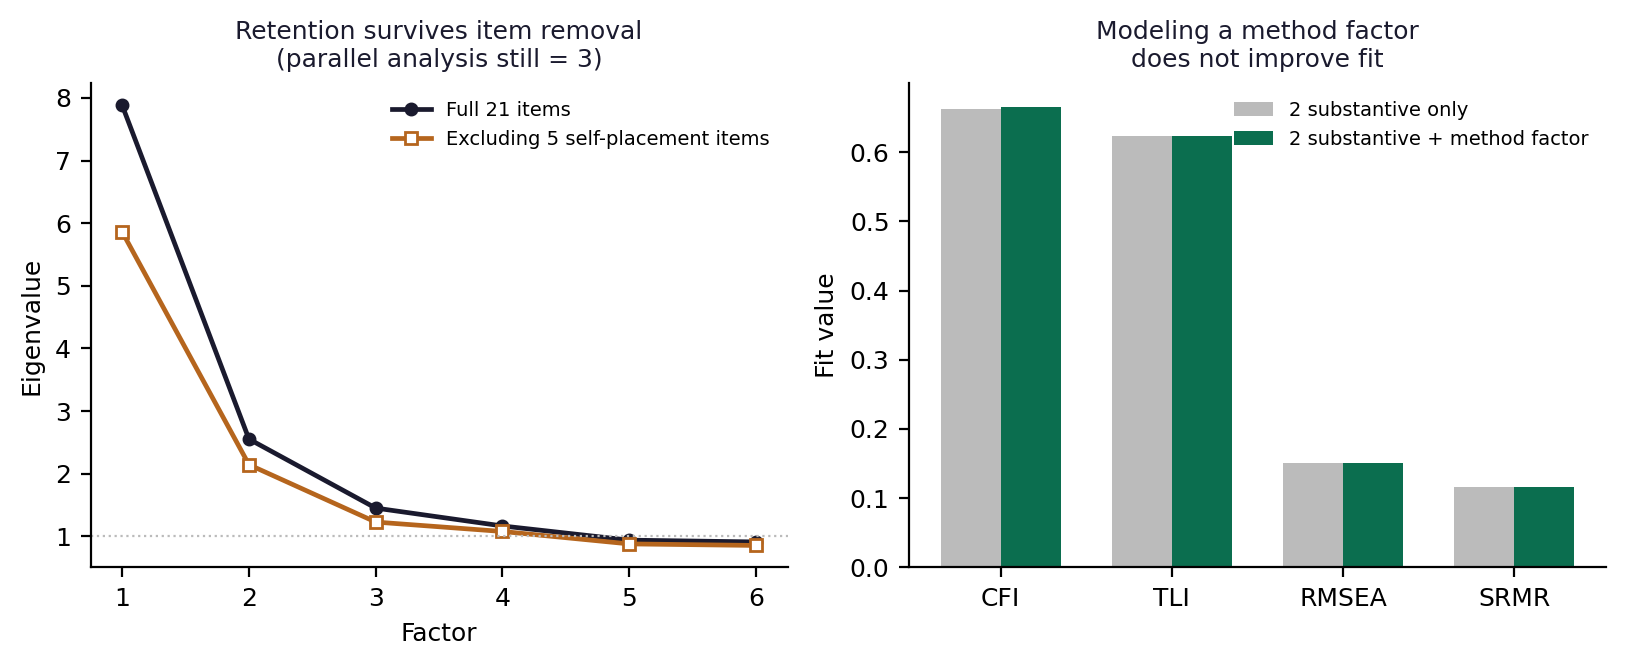
Figure 4. Method-factor robustness. Removing the five seven-point self-placement items leaves retention at three (left); explicitly modeling a method factor on those items does not improve confirmatory fit (right). The third factor is not a question-format artifact.
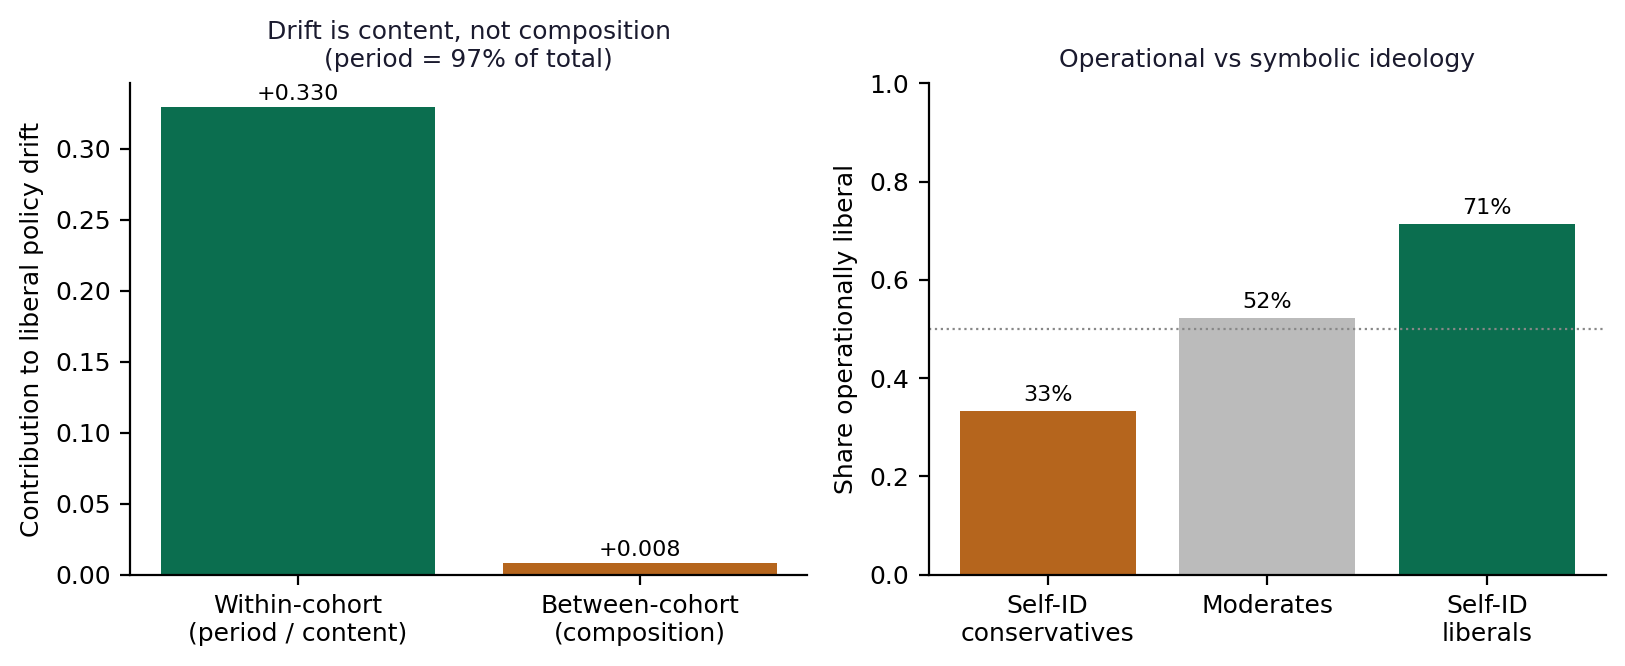
Figure 5. Drift decomposition and operational ideology. Liberals' policy drift is 97.6% within-cohort period change, not composition (left). Operational-liberal share by self-identification (right); see Section 2 on why conservative stability does not imply operational anchoring.
6. Discussion
The headline result is a disconfirmation of our own hypothesis, and its content is more interesting than the hypothesis would have been. Mass political belief in 2020 is not organized into four tidy principles. It is organized into a dominant ideological dimension that has absorbed economics, race, and environment into a single correlated bundle; a distinct authoritarian–conformity dimension; and a residual scope dimension. The fusion is the finding. The reason a colorblind-universalist position feels homeless on the popular compass is not that universalism is a missing fourth axis; it is that racial and identity attitudes have collapsed into the main left–right factor, so that a person who holds economically centrist but group-blind universalist views is pulled in two directions along a single axis that no longer separates the two.
This dovetails with the GSS evidence in Section 2. The same five decades over which ideology and party fused into a single tribal signal are the decades over which, in the cross-section, formerly distinguishable attitude domains have become correlated enough to load on one factor. Sorting at the level of identity and constraint at the level of belief structure are two views of the same process. The popular compass fails in part because it was implicitly calibrated to an earlier, less sorted electorate in which its axes were more nearly independent.
The failure of the epistemic axis deserves emphasis precisely because it is inconvenient. It is tempting, in the current climate, to posit a clean divide between evidence-respecting and intuition-respecting citizens and to treat it as a fundamental axis of politics. Our pre-registered items for that divide did not cohere. This does not prove no such dimension exists; it shows that it is not recoverable as a single factor from these standard items, and it cautions against building a compass on an axis that survey responses do not support. A dimension one can describe is not thereby a dimension that exists.
What, then, would an honest compass look like? Three principles follow, each stated with a caveat we did not give them in an earlier draft. First, axes should be made explicit and testable at the item level rather than asserted through evocative names. We stress that deriving structure from responses does not escape assertion—it relocates it to the choice of item battery, and our own epistemic-axis null shows that choice has real consequences for what is recovered. The honest gain is not a view from nowhere but an assertion that is auditable. Second, because structure changes over time, cross-period comparison should be anchored through measurement invariance on a stable set of marker items, in the standard psychometric manner, rather than either freezing the axes by fiat or re-estimating them with no anchor at all. The naive recommendation to 're-estimate every wave' would destroy the comparability that makes a compass useful; the remedy is anchored partial invariance, not unconstrained re-estimation. Third, labels should be treated as the least reliable part of the instrument: the same word denotes different bundles in different decades and increasingly functions as a team flag, as both the drift and sorting evidence show. None of this yields a new fixed cartography, and we do not offer one. It yields a discipline for building and revising maps honestly.
7. Limitations
Several scope conditions bound these findings, and two are severe enough that we state them as headline qualifications rather than afterthoughts. First, 2020 was an extraordinary, high-salience, peak-sorting year—a pandemic election with post-2020 racial salience at a historic high. The fusion of economic, racial, and environmental attitudes onto a single dominant factor may reflect maximal momentary co-activation rather than a structural constant, and a single cross-section cannot distinguish 'permanently fused' from 'maximally co-activated in one extraordinary year.' The fusion result should be read as a 2020 observation requiring replication; the natural next study re-runs this pipeline on the 2012 and 2016 ANES to see whether the domains were as fused before the most sorted election in living memory. Second, linear common-factor analysis can represent only dimensional structure; it is structurally blind to typological or configural organization. A three-factor result therefore cannot establish that belief is dimensionally rather than typologically organized—the question is partly begged by reaching for factor analysis at all—so our claims are explicitly conditional on a dimensional framework. Beyond these, the analysis is confined to the United States, where constraint is partly a function of elite sorting and the factor structure should be expected to differ in other party systems. The ANES battery was not designed to test our four-axis hypothesis, and the epistemic-orientation items in particular were sparse and indirect; that null should be read as 'not supported by these items' rather than 'does not exist.' The GSS policy index depends on items whose availability varies across years, and self-identification scales carry response-style artifacts; the cohort decomposition mitigates but does not eliminate the limits of repeated cross-sections without panel data.
None of these limitations rescues the four-axis hypothesis, and several of them were anticipated in the pre-registration. They bound the generality of the positive findings—three factors, fusion, drift, sorting—rather than reopening the disconfirmed ones.
8. Conclusion
We treated the popular political compass as a measurement instrument and tested it. Two of its asserted enrichments—a universalism axis and an epistemic axis—do not separate as specified in the 2020 ANES, and its labels have drifted in meaning and hardened into tribal signals over the past half-century. But we are careful about what this does and does not show. It does not show that political belief 'has' three dimensions: that count is a property of this battery in this year, as our own epistemic-axis null makes plain, and the fourth factor replicates weakly enough (Tucker congruence .92) that the count is a soft lower bound. Nor does a dimensional method adjudicate whether belief is dimensional or typological. What survives is provenance and labels, not a new fixed cartography: the compass's axes are asserted rather than derived, and its labels have decoupled from positions—both demonstrable here. The constructive lesson is correspondingly modest. A trustworthy ideological map should make its item-level assertions explicit and testable rather than smuggling them into axis names, and should anchor cross-time comparison through measurement invariance on marker items rather than asserting a fixed coordinate system or, equally unhelpfully, re-estimating axes with no anchor at all. We offer the disconfirmation of our own four-axis model, and our re-testing of this paper's own first draft against a serious critique, as small demonstrations of the discipline such a map requires.
References
American National Election Studies. (2021). ANES 2020 Time Series Study Full Release [dataset and documentation]. www.electionstudies.org.
Bartlett, M. S. (1950). Tests of significance in factor analysis. British Journal of Psychology, 3(2), 77–85.
Converse, P. E. (1964). The nature of belief systems in mass publics. In D. Apter (Ed.), Ideology and Discontent. Free Press.
Costello, A. B., & Osborne, J. (2005). Best practices in exploratory factor analysis. Practical Assessment, Research & Evaluation, 10(7).
Davis, J. A., Smith, T. W., & Marsden, P. V. (2024). General Social Surveys, 1972–2024 [cumulative file]. NORC, University of Chicago.
Feldman, S., & Johnston, C. (2014). Understanding the determinants of political ideology. Political Psychology, 35(3), 337–358.
Graham, J., Haidt, J., & Nosek, B. A. (2009). Liberals and conservatives rely on different sets of moral foundations. Journal of Personality and Social Psychology, 96(5), 1029–1046.
Haidt, J. (2012). The Righteous Mind: Why Good People Are Divided by Politics and Religion. Pantheon.
Horn, J. L. (1965). A rationale and test for the number of factors in factor analysis. Psychometrika, 30(2), 179–185.
Iyengar, S., Lelkes, Y., Levendusky, M., Malhotra, N., & Westwood, S. J. (2019). The origins and consequences of affective polarization in the United States. Annual Review of Political Science, 22, 129–146.
Kaiser, H. F. (1974). An index of factorial simplicity. Psychometrika, 39(1), 31–36.
Mason, L. (2018). Uncivil Agreement: How Politics Became Our Identity. University of Chicago Press.
Stenner, K. (2005). The Authoritarian Dynamic. Cambridge University Press.
Tucker, L. R. (1951). A method for synthesis of factor analysis studies (Personnel Research Section Report No. 984). Department of the Army.
Velicer, W. F. (1976). Determining the number of components from the matrix of partial correlations. Psychometrika, 41(3), 321–327.
Ellis, C., & Stimson, J. A. (2012). Ideology in America. Cambridge University Press.
Firebaugh, G. (1997). Analyzing Repeated Surveys. Sage.
Free, L. A., & Cantril, H. (1967). The Political Beliefs of Americans. Rutgers University Press.
Stimson, J. A. (2004). Tides of Consent: How Public Opinion Shapes American Politics. Cambridge University Press.
Appendix: Reproducibility
All results in this paper are reproducible from public microdata. The analysis pipeline—comprising the polychoric correlation estimator, parallel analysis, Velicer's MAP, iterated principal-axis factoring, promax rotation, Tucker congruence, and maximum-likelihood confirmatory factor analysis—was implemented on a standard scientific-Python stack with no specialized dependencies, and validated against data of known factor structure before application. The pre-registered item map, recoding rules, factor-retention and model-fit criteria, and the disconfirmation logic were fixed in code before the microdata were examined. The ANES 2020 Time Series and the GSS 1972–2024 cumulative file are available from their respective archives. Reported quantities include: KMO = 0.870; factors retained = 3 (parallel analysis and MAP in agreement); four-axis confirmatory fit CFI = 0.696, TLI = 0.651, RMSEA = 0.145, SRMR = 0.120; and split-half Tucker congruence for the three retained factors of 0.97, 1.00, 0.99.
Companion: Response to Critique, which re-runs the two tests a critic named as decisive and reports what survived re-testing.